Spending active time outdoors plays a vital role in fostering our overall well-being. It not only enhances our physical and mental health but also contributes to building a stronger sense of community. Cities across the United States have made substantial investments in providing ample outdoor recreational opportunities for residents. Leveraging data from the Trust for Public Land, we've developed a ranking system to pinpoint the top cities for outdoor recreation. This comprehensive data encompasses the top 100 cities by population, offering valuable insights into the most favorable cities for outdoor recreation.
Here is our list of the Top 20 Best Cities For Outdoor Recreation!
1. Irvine, CA

Total Parkland Area Score: 3.3
Park Access Score: 9.4
Trail Miles Per Capita Score: 9.9
Playgrounds Per Capita Score: 2.7
Sports Amenities Per Capita Score: 5.5
Pools & Splash Pads Per Capita Score: 1.4
Total Score: 3.21
2. Washington, DC

Total Parkland Area Score: 3.0
Park Access Score: 9.9
Trail Miles Per Capita Score: 9.4
Playgrounds Per Capita Score: 1.4
Sports Amenities Per Capita Score: 3.7
Pools & Splash Pads Per Capita Score: 4.3
Total Score: 31.7
3. Pittsburgh, PA

Total Parkland Area Score: 1.8
Park Access Score: 9.2
Trail Miles Per Capita Score: 5.9
Playgrounds Per Capita Score: 2.8
Sports Amenities Per Capita Score: 4.3
Pools & Splash Pads Per Capita Score: 7.7
Total Score: 31.7
4. Cincinnati, OH

Total Parkland Area Score: 2.1
Park Access Score: 8.8
Trail Miles Per Capita Score: 3.2
Playgrounds Per Capita Score: 5.8
Sports Amenities Per Capita Score: 6.1
Pools & Splash Pads Per Capita Score: 5.5
Total Score: 31.5
5. Las Vegas, NV

Total Parkland Area Score: 2.3
Park Access Score: 7.4
Trail Miles Per Capita Score: 0.8
Playgrounds Per Capita Score: 10
Sports Amenities Per Capita Score: 4.5
Pools & Splash Pads Per Capita Score: 3.3
Total Score: 28.3
6. Omaha, NE

Total Parkland Area Score: 1.5
Park Access Score: 8.2
Trail Miles Per Capita Score: 6.2
Playgrounds Per Capita Score: 2.8
Sports Amenities Per Capita Score: 5.4
Pools & Splash Pads Per Capita Score: 2.7
Total Score: 26.8
7. Anchorage, AK

Total Parkland Area Score: 10
Park Access Score: 7.6
Trail Miles Per Capita Score: 2
Playgrounds Per Capita Score: 2.2
Sports Amenities Per Capita Score: 3.5
Pools & Splash Pads Per Capita Score: 0.8
Total Score: 26.1
8. Minneapolis, MN

Total Parkland Area Score: 1.9
Park Access Score: 9.8
Trail Miles Per Capita Score: 2.7
Playgrounds Per Capita Score: 2.8
Sports Amenities Per Capita Score: 6.7
Pools & Splash Pads Per Capita Score: 2.2
Total Score: 26.1
9. Cleveland, OH

Total Parkland Area Score: 0.9
Park Access Score: 8.3
Trail Miles Per Capita Score: 1.3
Playgrounds Per Capita Score: 2.2
Sports Amenities Per Capita Score: 3.3
Pools & Splash Pads Per Capita Score: 10
Total Score: 26.0
10. St. Paul, MN

Total Parkland Area Score: 1.9
Park Access Score: 9.9
Trail Miles Per Capita Score: 1.6
Playgrounds Per Capita Score: 2.8
Sports Amenities Per Capita Score: 8.2
Pools & Splash Pads Per Capita Score: 1.1
Total Score:
11. Madison, WI

Total Parkland Area Score: 1.8
Park Access Score: 9.5
Trail Miles Per Capita Score: 1.7
Playgrounds Per Capita Score: 4.9
Sports Amenities Per Capita Score: 7.0
Pools & Splash Pads Per Capita Score: 0.6
Total Score: 25.5
12. Arlington, VA

Total Parkland Area Score: 1.4
Park Access Score: 9.9
Trail Miles Per Capita Score: 1.8
Playgrounds Per Capita Score: 3.8
Sports Amenities Per Capita Score: 6.5
Pools & Splash Pads Per Capita Score: 2.1
Total Score: 25.5
13. Scottsdale, AZ

Total Parkland Area Score: 3.4
Park Access Score: 4
Trail Miles Per Capita Score: 10
Playgrounds Per Capita Score: 1.1
Sports Amenities Per Capita Score: 4.9
Pools & Splash Pads Per Capita Score: 1.4
Total Score: 24.9
14. Lincoln, NE

Photo Credit: Kathy Plunkett Photography
Total Parkland Area Score: 0.8
Park Access Score: 9.0
Trail Miles Per Capita Score: 2.7
Playgrounds Per Capita Score: 3.2
Sports Amenities Per Capita Score: 6.2
Pools & Splash Pads Per Capita Score: 1.7
Total Score: 23.6
15. Boston, MA

Total Parkland Area Score: 2.3
Park Access Score: 10
Trail Miles Per Capita Score: 0.0
Playgrounds Per Capita Score: 2.0
Sports Amenities Per Capita Score: 2.2
Pools & Splash Pads Per Capita Score: 7.0
Total Score: 23.5
16. Henderson, NV

Total Parkland Area Score: 1.0
Park Access Score: 7.5
Trail Miles Per Capita Score: 3.6
Playgrounds Per Capita Score: 2.0
Sports Amenities Per Capita Score: 4.6
Pools & Splash Pads Per Capita Score: 4.2
Total Score: 22.9
17. Chesapeake, VA
![]()
Total Parkland Area Score: 3.4
Park Access Score: 4.6
Trail Miles Per Capita Score: 2.0
Playgrounds Per Capita Score: 2.6
Sports Amenities Per Capita Score: 10
Pools & Splash Pads Per Capita Score: 0.2
Total Score: 22.8
18. Tulsa, OK

Total Parkland Area Score: 0.9
Park Access Score: 6.5
Trail Miles Per Capita Score: 2.3
Playgrounds Per Capita Score: 3.3
Sports Amenities Per Capita Score: 5.8
Pools & Splash Pads Per Capita Score: 3.9
Total Score: 22.7
19. Plano, TX

Total Parkland Area Score: 1.3
Park Access Score: 8.0
Trail Miles Per Capita Score: 1.7
Playgrounds Per Capita Score: 3.5
Sports Amenities Per Capita Score: 4.3
Pools & Splash Pads Per Capita Score: 3.8
Total Score: 22.6
20. Norfolk, VA

Photo Credit: VisitNorfolk.com
Total Parkland Area Score: 0.6
Park Access Score: 7.7
Trail Miles Per Capita Score: 0.4
Playgrounds Per Capita Score: 4.9
Sports Amenities Per Capita Score: 7.1
Pools & Splash Pads Per Capita Score: 1.5
Total Score: 22.2
Here is an infographic we created so you can see how each city compares.
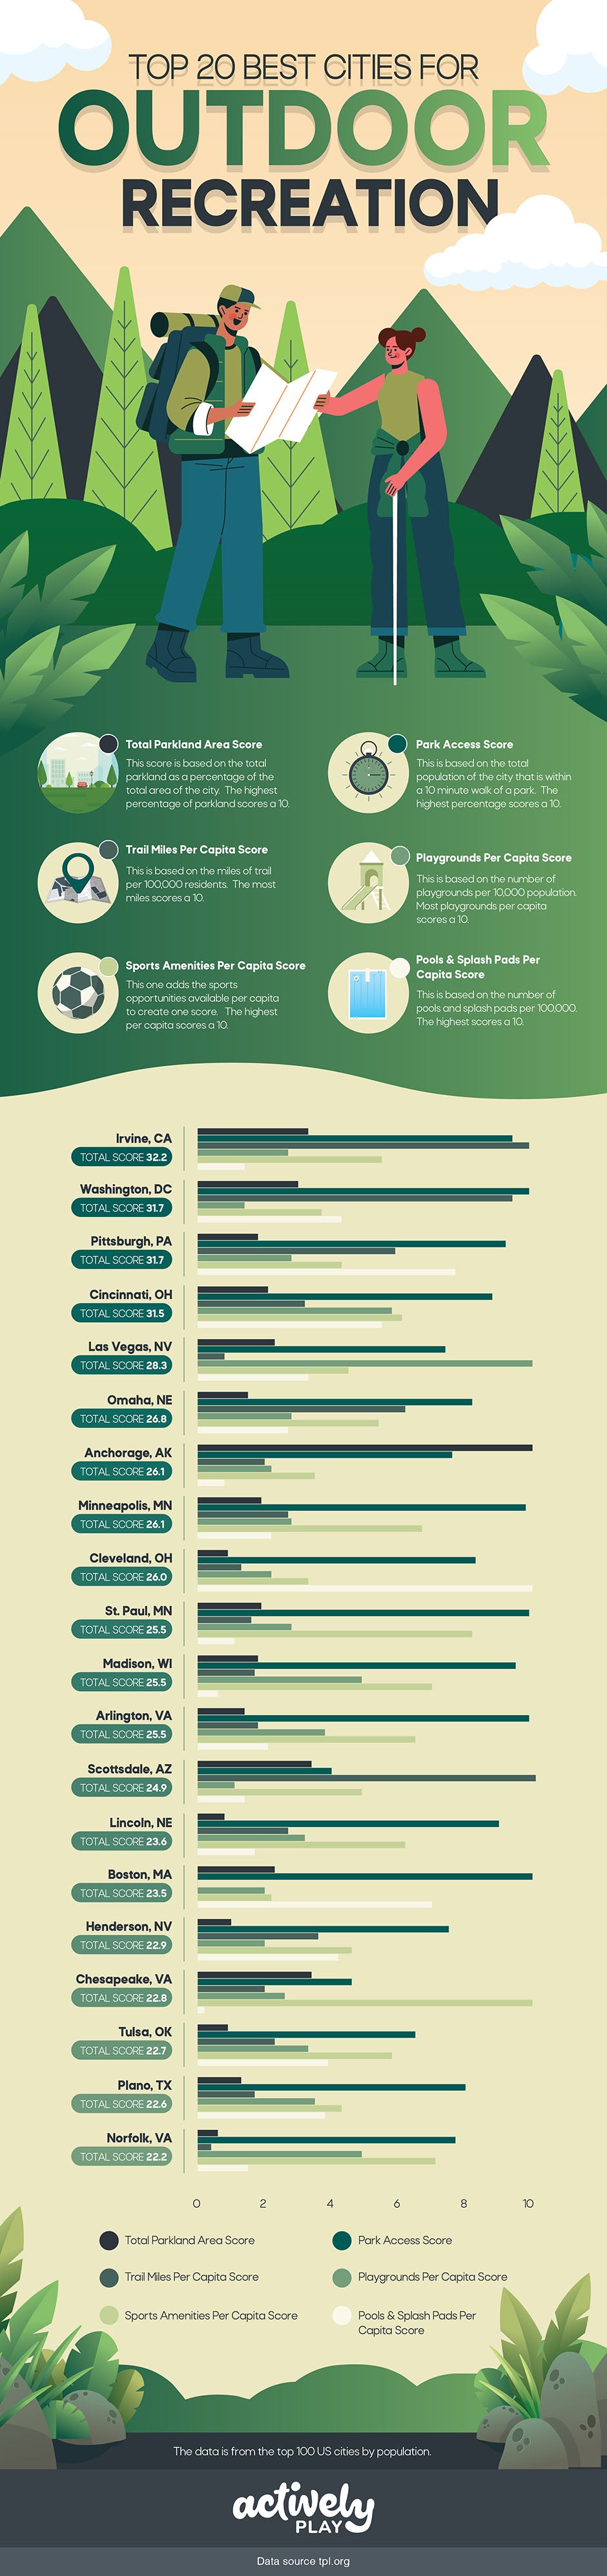
Scoring System
We used the raw data for the top 100 U.S. Cities by population to create a score from 0 to 10 for each category. A score of 10 represents the peak of that category while a score of 5 represents half of the peak. For example, Las Vegas, NV has the most playgrounds per capita at 14 per 100,000 residents. Las Vegas scores a 10 in that category. Madison, WI has 7 playgrounds per 100,000 residents so Madison scores a 5.
Total Parkland Area Score
This category looks at the total park land area of a city as a percentage of the total area of the city. Anchorage, AK wins this category by a massive margin! 80% of Anchorage’s 1,087,624 total acres is park land. That equates to 3,000 acres of park per 1,000 people!
Here are the top 5 in this category:
- Anchorage, AK - Score: 10
- Fremont, CA - Score: 5.5
- Chesapeake, VA - Score: 3.4
- Scottsdale, AZ - Score: 3.4
- Irvine, CA - Score: 3.3
Trail Miles Per Capita Score
This category is calculated from the data for trail miles per 100,000 residents. Both natural trails and improved trails are figured in the score. Natural trail miles include trails in designated natural areas or areas with a natural buffer away from roads and buildings. Improved trails are trails that have been surfaced with pavement, gravel, etc. Improved trails may be inside or outside a park but do not include on-street trails.
Here are the top 5 in this category:
- Scottsdale, AZ - Score: 10
- Irvine, CA - Score: 9.9
- Washington, DC - Score: 9.4
- Omaha, NE - Score: 6.2
- Pittsburgh, PA - Score: 5.9
Sports Amenities Per Capita Score
This category takes into account public places or opportunities to play sports within a city. Included in the score are per capita diamonds, play fields, courts, pickleball & tennis, volleyball nets, basketball hoops, skate parks, and disc golf courses.
Here are the top 5 in this category:
- Chesapeake, VA - Score: 10
- St. Paul, MN - Score: 8.2
- Baton Rouge, LA - Score: 7.2
- Norfolk, VA - Score: 7.1
- Madison, WI - Score: 7.0
Park Access Score
This score is based on the percentage of residents that are within a 10 minute walkable route to a park. This takes into account physical barriers like highways, train tracks, and rivers without a bridge.
The top park access scores are very close so I’m going to list the top 10 and show the percentage of residents within a 10 mile walkable route instead of the score.
Here are the top 10 in this category:
- Boston, MA - 100%
- San Francisco, CA - 100%
- Arlington, VA - 99%
- New York, NY - 99%
- Seattle, WA - 99%
- St. Paul, MN - 99%
- Washington, DC - 99%
- Chicago, IL - 98%
- Jersey City, NJ - 98%
- Minneapolis, MN - 98%
Playgrounds Per Capita Score
This score is based on the number of playgrounds per capita. Playgrounds in parks and playgrounds in schoolyards that are open to the public are included in the score.
Here are the top 5 in this category:
- Las Vegas, NV - Score: 10
- Cincinnati, OH - Score: 5.8
- Norfolk, VA - Score: 4.9
- Madison, WI - Score: 4.9
- Arlington, VA - Score: 3.8
Pools & Splash Pads Per Capita Score
This Category considers the number of swimming pools and splash pads per capita for the city.
Here are the top 5 in this category:
- Cleveland, OH - Score: 10
- Pittsburgh, PA - Score: 7.7
- Boston, MA - Score: 7.0
- Cincinnati, OH - Score: 5.5
- Chicago, IL - Score: 4.9